BUSINESS INTELLIGENCE
Be successful. Make the right decisions. Based on genuine and reliable data.
Stop guessing. Be smart. Transform information into a digestible format. Identify opportunities for improvement. Focus on processing and understanding.
Don’t go crazy. Think simple. Simplify your corporate and departmental reporting. Only generate relevant information.
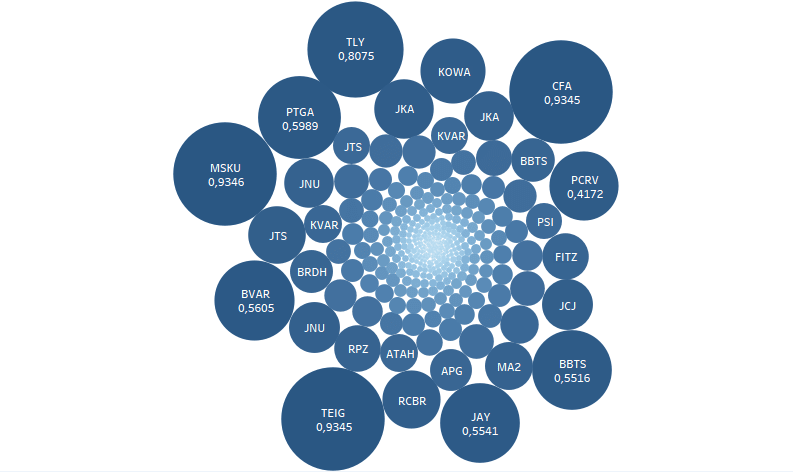
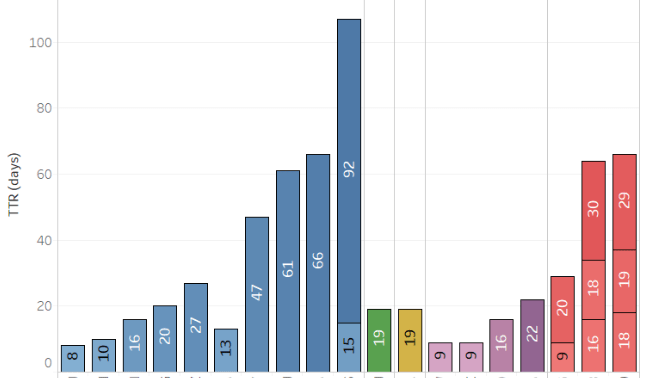
Get the picture. Fast. Visually explore your data. Discover new patterns. Identify key relationships. Unearth hidden opportunities.
The key to success is to base your strategic decisions on reliable data. By understanding how your company works, and the behaviour of your clients, you can anticipate the future.
By displaying information in an easily understandable way you can distinguish patterns, identify outliers and negative trends, and graphically visualize relationships among elements that you may otherwise have overlooked.
The reports you generate are the face of your company towards your clients and stakeholders. Data visualization techniques allow you to present your company in a more professional way and to transmit the right message.
ETL (Extract, Transform, Load) procedures extract, transform and load information into a database for further analysis. This process even allows users without IT skills to access the data.
The solution we propose is not to install a tool that would make the decisions for you. We propose to work together with you, to reorganize, analyse, and interpret the data, to define metrics aligned with your goals, and to generate relevant scorecards, reports and templates that you can reuse.
Data analytics allows discriminating only relevant information in accordance with the company goals.
Your staff needs necessary and reliable information in a timely format to perform their duties.
It usually goes unnoticed, but a large amount of working time is devoted to gathering data and generating reports. This ineffective use of the company’s resources leads to a lack of coordination and wrong decisions.
By applying business intelligence techniques, you will increase your company’s efficiency.
Data visualization is as important as data analytics.
Data visualization tools allow the graphic presentation of any kind of information in an easy and visual way, which is crucial in the Big Data era, where we have to be able to extract a multitude of data within a short period of time.
Data visualization tools do not require knowledge of programming or database management. They allow for interactive use, and for sharing and publishing results in a clear and appealing way.
Business intelligence solutions cover a spectrum from predefined reports, templates, query automation and alarms to dashboard design.
In summary, they allow to:
- Observe what is happening
- Understand why it happens
- Forecast what would happen
- Decide what to change
- Communicate positive developments